What This Plugin Does — and Why I Built It This Way
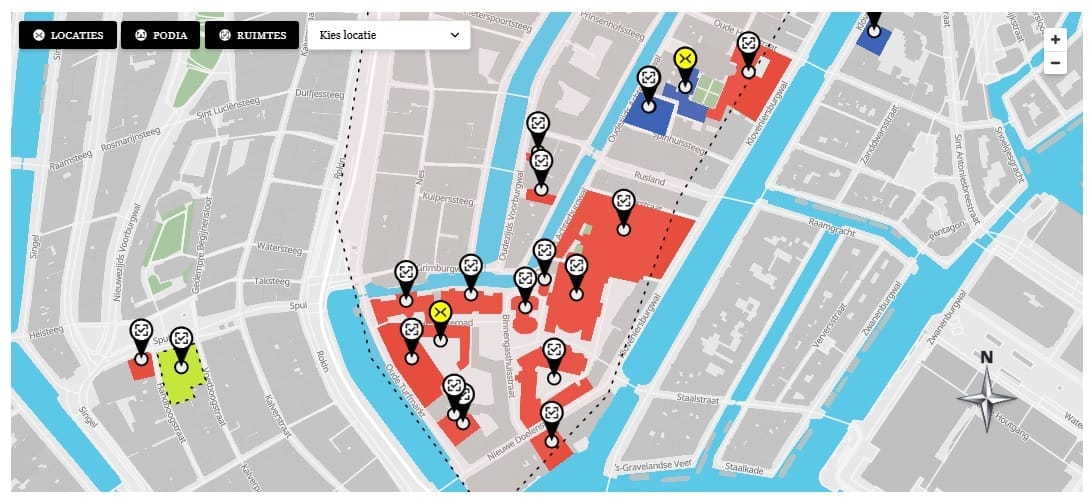
Most map plugins you find in the WordPress repository are black boxes. You install them, configure some settings through a UI, and get a map — but you have no control over how the data is structured, how the frontend renders, or how the map integrates with the rest of your site. When a client needed a fully custom interactive map with polygon areas, multi-category filtering, and clickable location cards, none of the existing plugins came close to what was required.
So I built one. This series documents exactly how the plugin was built — every file, every architectural decision, and every real-world problem that came up during development. The plugin uses two Custom Post Types (one for maps, one for locations), a custom taxonomy for categories, MapLibre GL JS on the frontend for full map color control, and Leaflet Draw in the admin for polygon editing. The result is a plugin where you control everything.
The Stack at a Glance
The plugin is organized around a simple principle: keep data in WordPress (CPTs and post meta), keep rendering in JavaScript (MapLibre GL JS), and keep the admin editing experience in Leaflet (because Leaflet Draw is mature and well-documented). Here is what the plugin uses and why:
- MapLibre GL JS 4.7.1 — Frontend map rendering. Unlike Leaflet, MapLibre uses vector tiles and a full style JSON, which means you can change every color on the map — roads, water, buildings, labels — all from your own code. This was a hard requirement from the project.
- Leaflet 1.9.4 + Leaflet Draw 1.0.4 — Admin-only polygon drawing tool. Leaflet is used exclusively in the WordPress admin for the location editor metabox. It does not appear on the frontend.
- Pickr 1.9.1 — Color picker library used in the admin for category colors and per-location area color overrides. It supports rgba() output natively, which matters because MapLibre needs opacity as a separate value.
- OpenFreeMap vector tiles — Free vector tile source used as the base map. No API key required, no usage limits for reasonable traffic.
- WordPress Custom Post Types —
map10_mapstores map configuration (center coordinates, zoom level).map10_locationstores each location (coordinates, polygon GeoJSON, description, image, URL, and all visual settings).
Plugin File Structure
Understanding the file structure before diving into any individual file makes the series easier to follow. The plugin lives in wp-content/plugins/map-2-0/ and is organized as follows:
map-2-0/
├── map-2-0.php                        ← Main plugin file: constants, includes, asset enqueue
├── includes/
│   ├── cpt-maps.php                   ← Registers map10_map CPT
│   ├── cpt-locations.php              ← Registers map10_location CPT
│   ├── taxonomy-categories.php        ← Registers taxonomy + color/icon fields
│   └── shortcodes.php                 ← [map10] shortcode + iframe embed handler
├── admin/
│   ├── admin-categories.php           ← Admin category management page
│   ├── js/
│   │   ├── location-editor.js         ← Leaflet Draw polygon editor (admin only)
│   │   ├── map-editor.js              ← Map center picker (admin only)
│   │   └── auto-location-detector.js  ← Auto-detect center from polygon centroid
│   └── metaboxes/
│       ├── map-settings.php           ← Map CPT metabox: center, zoom, embed code
│       └── location-fields.php        ← Location CPT metabox: all location fields
└── public/
    ├── css/
    │   ├── map.css                    ← Frontend map styles
    │   ├── map10-fonts.css            ← Custom font declarations
    │   └── map10-css.min.css          ← Minified additional styles
    ├── js/
    │   └── map.js                     ← Frontend map rendering (MapLibre)
    ├── fonts/                         ← Utopia font files
    └── images/
        ├── Default_pin.png            ← Default marker image
        ├── close.png                  ← Close button image
        └── compass.png                ← Compass overlay image
How the Data Flows
From WordPress to the Browser
The data flow is straightforward and worth understanding before writing a single line of code. When a page containing the [map10 id="123"] shortcode is loaded, the shortcode handler in shortcodes.php runs map10_build_map_payload(). This function queries all published locations assigned to that map ID, fetches all category terms with their colors and icons, and encodes everything as a JSON object injected directly into the page inside a <script> tag assigned to window.map10Data.
The frontend JavaScript in map.js reads window.map10Data on DOMContentLoaded, initializes a MapLibre map for each map ID found, and renders polygons and markers from the location data. No AJAX, no REST API calls during page load — all data is server-rendered into the page. This keeps the map fast to initialize and makes it work without any client-side authentication.
Post Meta Keys Reference
Every piece of location data is stored as post meta. Here is the full reference for map10_location post meta keys — useful to have before reading the individual tutorials:
_map10_map_id              → int     — ID of the parent map10_map post
_map10_lat                 → float   — Marker latitude (auto-calculated from polygon centroid)
_map10_lng                 → float   — Marker longitude
_map10_polygons            → string  — GeoJSON FeatureCollection (polygon data)
_map10_desc                → string  — HTML description shown in the info box
_map10_url                 → string  — Link URL for the info box button
_map10_url_slug            → string  — Custom slug for URL overwrite
_map10_link_button_text    → string  — Button label (default: "Boek een ruimte")
_map10_marker_icon         → string  — URL of custom marker image
_map10_image               → string  — URL of info box image
_map10_border_style        → string  — "none" | "solid" | "dotted"
_map10_border_color        → string  — Hex color for border (#000000)
_map10_border_width        → int     — Border width in pixels
_map10_hide_from_dropdown  → bool    — 1 = hidden from location select dropdown
_map10_hide_pinpoint       → bool    — 1 = no marker rendered, area still shows
_map10_area_color_override → string  — rgba() or #hex — overrides category color for this location
One Decision That Changed Everything: Leaflet to MapLibre
The original version of this plugin used Leaflet on both the admin and the frontend. That worked well for polygon drawing, but it created one hard limitation: you cannot change the colors of a tile-based map. Leaflet uses raster tiles — pre-rendered PNG images served by a tile server. You cannot make the water blue instead of light grey, or change road colors, because those colors are baked into the images. The only way to change them is to use a different tile provider that happens to have the color scheme you want.
The solution was to switch the frontend to MapLibre GL JS, which uses vector tiles instead of raster tiles. With vector tiles, the map data (roads, buildings, water, labels) comes as raw vector geometry, and you apply a style JSON to define exactly how each layer looks. That style JSON lives entirely in your own JavaScript — you own every color. The admin kept Leaflet Draw because polygon drawing support in MapLibre is significantly more complex to implement, and Leaflet Draw already worked perfectly.
This split — Leaflet in admin, MapLibre on frontend — is an unusual architecture, but it is the right tradeoff for this use case. Each library does what it does best.
What Each Tutorial Covers
This series is structured so each article covers one self-contained piece of the plugin. You can read them in order to build the full plugin, or jump to a specific article if you are adding one feature to an existing plugin.
- Registering Custom Post Types for Map and Location — How to register
map10_mapandmap10_locationwith the correct arguments, whyshow_in_menuis set to the parent CPT slug, and how to structure the plugin’s main file and constants. - Building the Location Category Taxonomy with Color and Icon Pickers — How to register a custom taxonomy with term meta fields, integrate the Pickr color picker to store rgba() values, and use the WordPress media uploader for category icons.
- Integrating MapLibre GL JS as a Custom-Styled Base Map — How to build a MapLibre style JSON from scratch using OpenFreeMap vector tiles, define map colors in a central config object, and initialize the map from shortcode-injected data.
- Drawing and Saving Polygons with Leaflet Draw in the Admin — How to set up the admin map editor, integrate Leaflet Draw, serialize polygon data as GeoJSON, and auto-calculate the location center from the polygon centroid.
- Building Category Filter Buttons and a Synced Location Dropdown — How to render filter buttons from taxonomy data, update polygon opacity and marker size on filter change, and keep the dropdown in sync with the active filter.
- Building the Location Info Box: Click Polygon or Marker to Show Details — How to attach click events to both MapLibre polygon layers and custom markers, populate the info box with location data, and handle switching between locations without closing and reopening manually.
- Per-Location Controls: Border Style, Visibility Toggle, and Color Override — How to implement per-location border rendering in MapLibre, hide locations from the dropdown while keeping them visible on the map, and override the category color for individual locations.
- Shortcode Output and Iframe Embed: Rendering the Map on Any Page — How the shortcode handler builds and serializes the map payload, generates the HTML structure, injects data as window.map10Data, and how the iframe embed endpoint works for embedding on external sites.
Table of Contents
- Registering Custom Post Types for Map and Location in WordPress
- Building a Location Category Taxonomy with Color and Icon Pickers
- Integrating MapLibre GL JS as a Custom-Styled Base Map in WordPress
- Drawing and Saving Polygons with Leaflet Draw in the WordPress Admin
- Building Category Filter Buttons and a Synced Location Dropdown
- Building the Location Info Box: Click Polygon or Marker to Show Details
- Per-Location Controls: Border Style, Visibility Toggle, and Area Color Override
- Shortcode Output and Iframe Embed: Rendering the Map on Any Page